How to check if your mutual funds are secretly the same
If you hold four or five mutual funds, there is a good chance they are quietly holding the same stocks. It is one of the most common hidden problems in an Indian investor's portfolio — and checking for it takes only a few minutes once you know how. This is a practical guide to finding mutual fund overlap in your own holdings.
The term sounds technical, but the idea is simple. Mutual fund overlap is the degree to which two funds you own hold the same underlying companies. If your large-cap fund and your flexi-cap fund both have Reliance, HDFC Bank, and Infosys among their top holdings, those two funds are not diversifying you the way you assumed. You are holding the same bets twice — and paying two separate expense ratios to do it.
We covered why this happens and why it undoes diversification in a separate piece on why owning five funds isn't diversification. This article is the how-to: the actual steps to measure overlap in your portfolio and decide what to do about it.
Why overlap is so common in Indian portfolios
It is not bad luck — it is structural. The Indian equity market is dominated by a relatively small number of very large companies, and almost every equity fund is measured against an index built from those same companies. So a large-cap fund, a flexi-cap fund, and even many "diversified" funds end up fishing in the same pond. Studies of Indian funds regularly find that two large-cap funds can share well over half their holdings by weight.
The result is what some call "diworsification" — you add more funds believing you are spreading risk, but you are really just buying more of the same top-ten stocks under different scheme names. More funds, more fees, and barely any additional diversification.
How to check mutual fund overlap: three approaches
1. The manual method (free, a bit of work)
Every mutual fund publishes a monthly factsheet listing its top holdings. Pull up the factsheets for two funds you own, look at their top ten or fifteen stocks, and note how many appear in both. If six of the top ten are identical, you have heavy overlap. This is rough — it ignores the exact weights — but for a quick gut check it works, and it costs nothing but time.
2. A mutual fund overlap calculator (fast, free)
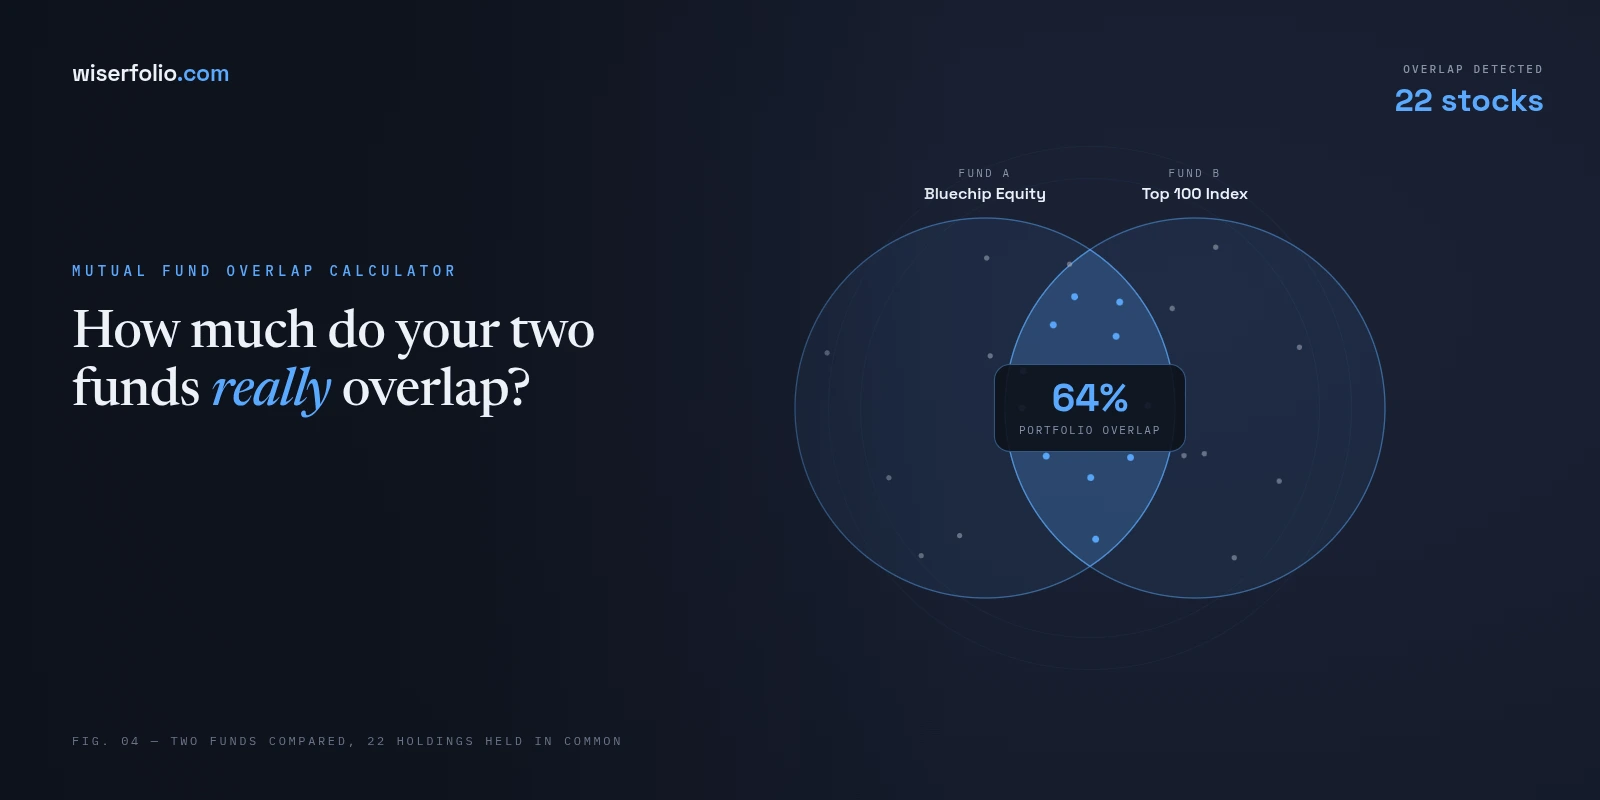
Several Indian platforms offer a free mutual fund overlap calculator where you select two or more schemes and it computes the percentage of holdings they share, often with a Venn diagram. These are genuinely useful for comparing a handful of specific funds, and they typically express the result as low (under 20%), moderate (20–60%), or high (above 60%) overlap. The limitation is that you check funds in pairs — they answer "do these two funds overlap," not "what does my whole portfolio look like."
3. A full portfolio analysis (the complete picture)
The most thorough approach is to look at your entire portfolio at once — not just two funds, but every holding together, including your direct stocks — and see your true combined exposure to each company and sector. This is exactly what Wiserfolio's mutual fund overlap calculator and portfolio analyzer does: you upload your holding statement and it reads every position, surfacing overlap, concentration, sector tilt, and fee drag in one report. Where a pair-wise calculator tells you two funds share 50%, a full analysis tells you that, across everything you own, you are actually 30% exposed to a single stock you didn't realise you held in three different funds.
Overlap is the starting point of portfolio analysis, not the end. Once you know two funds duplicate each other, the real questions are how concentrated that makes you overall, and whether your money is doing what you actually need it to.
What counts as "too much" overlap?
There is no single threshold, but useful guidelines exist. Overlap below roughly 20% is normal and not worth worrying about. Between 20% and 50%, it is worth a look — especially if the two funds are in different categories and you bought them specifically to diversify. Above 50–60%, the two funds are effectively doing the same job, and holding both mostly adds cost without adding spread. At that point, keeping the better performer and exiting the other is often the cleaner choice.
One caveat: overlap alone shouldn't drive a decision. Two funds can share many stocks but weight them very differently, which changes how they behave. So treat a high overlap number as a flag to investigate, not an automatic instruction to sell.
What to do when you find heavy overlap
If you discover two funds are largely duplicates, the usual fixes are straightforward. You might consolidate — keep the one with the better long-term record and lower expense ratio, and redirect the other. Or, if you want to keep both for some reason, you can replace one with a fund in a genuinely different space (a mid-cap, a sector fund, or an international fund) so the second slot actually adds something. The goal is for each fund you own to earn its place by giving you exposure the others don't.
Before making any switch, remember that exiting a fund can trigger capital gains tax and possibly an exit load, so the timing matters. And consolidating funds is really one piece of a larger question — how your whole portfolio is structured. If you want a framework for that bigger picture, our guide on how to read your portfolio like an analyst walks through the five structural questions worth asking, of which overlap is just the first.
The bottom line
Checking mutual fund overlap is one of the highest-value, lowest-effort things an investor can do — and most people never do it. Whether you compare factsheets by hand, run a pair of funds through a free overlap calculator, or analyse your whole portfolio at once, the point is to find out whether your funds are genuinely spreading your risk or quietly concentrating it. Concentration that hides inside "diversification" is one of the sneakiest risks in investing — and it is also one of the easiest to fix once you can see it. Related reading: when one stock is half your portfolio.
See your own portfolio's hidden risks
Upload your statement and Wiserfolio shows your concentration, fund overlap, fees, and tax moves in 90 seconds.
Analyze my portfolio free →